Security in Numbers: India's Military Expenditure

Summary:
The Security in Numbers series highlights and analyzes data, shedding light on numbers and issues that are critical to Indian national security.
The first edition focuses on India’s military expenditure. These figures are compared with expenditures by other South Asian actors, by its military adversaries, and, by the top five spenders.
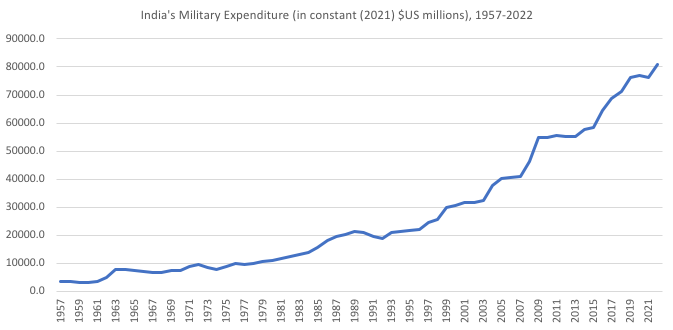
As Indian military expenditure data shows, India’s spending has increased steadily for years with a substantial jump over the past decade (spending grew by 47% from 2013 to 2022).
India’s rising military expenditure trend will likely continue even in the face of policy measures (such as the ‘Agnipath’ scheme) designed to reduce personnel costs; India’s expenditure might further increase substantially if tensions with either of its neighbors escalate.
Introduction:
In 2022, world military expenditure rose to $2240 billion, the highest figure ever recorded as per SIPRI (Stockholm International Peace Research Institute) data. India was the fourth largest spender globally in 2022 with a military expenditure of $81.4 billion.
India has consistently been a high spender and I place India’s military expenditure figures in context to spending by other state actors to give Indialog readers a sense of how India fares compared to its neighbors, military adversaries, and other top spenders.
Indian military expenditure in South Asia:
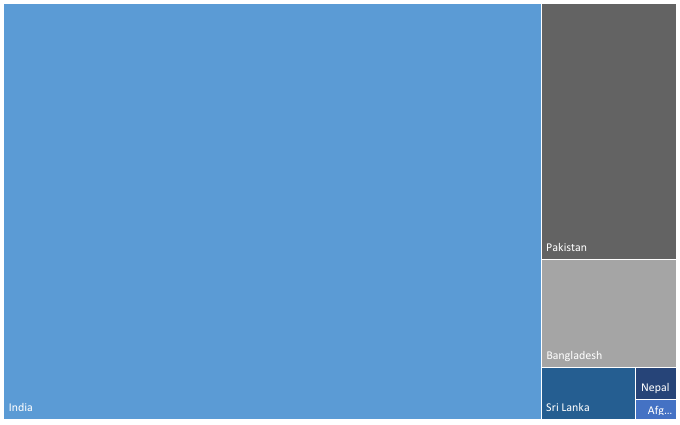
Within the subcontinent, India outspends its neighbors (Afghanistan, Bangladesh, Nepal, Pakistan, and Sri Lanka) by a substantial margin. SIPRI has data on military expenditure for all six South Asian nations for 2021 (2022 data is unavailable for Afghanistan). To put India’s expenditure in context within South Asia, the subcontinent’s total military expenditure was $95.5 billion with India accounting for $76.3 billion (see Fig. 1).
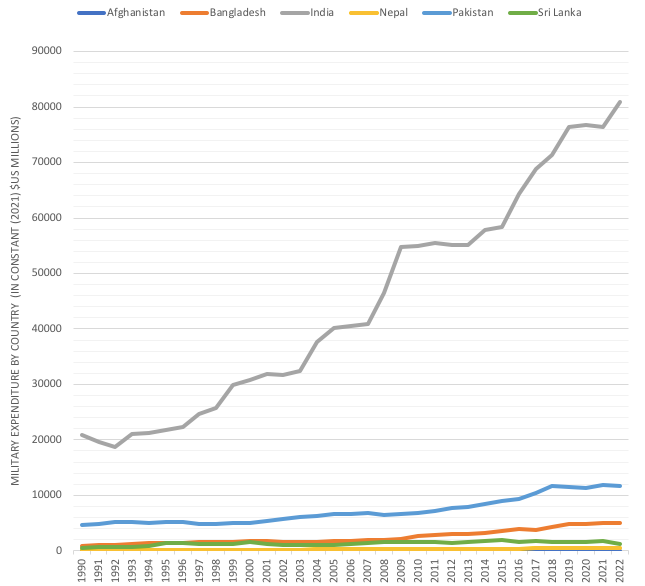
Historically, India has outspent its neighbors. Fig. 2 has data on military expenditure from 1990 onwards. As the graph shows, India, a giant in the region, has consistently spent magnitudes more on its military requirements compared to other South Asian nations.
India’s military expenditure compared to China & Pakistan’s expenditures:
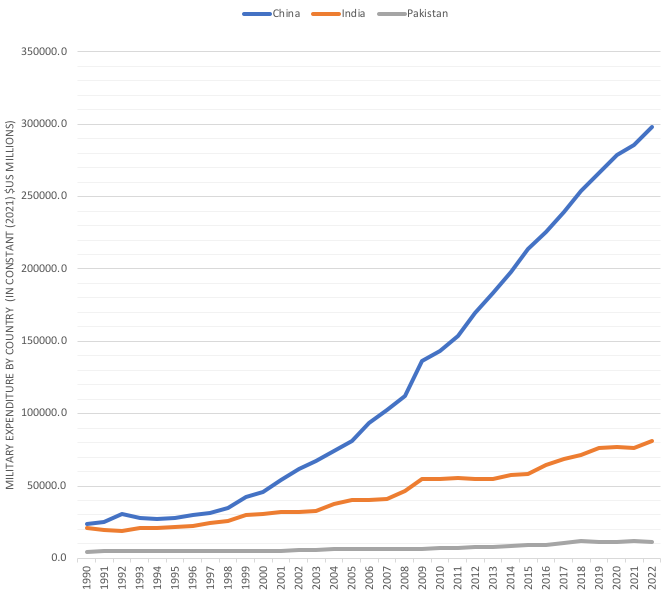
A useful exercise is to look at Indian military expenditure relative to its principal adversaries. Fig. 3 shows Indian figures compared to Chinese and Pakistani data. As the numbers show, China’s military expenditure is substantively higher than India’s for over two decades. It is interesting to note that this wasn’t always the case. In 1990, the two nations had similar military expenditures with China at $23.5 billion and India at approximately $21 billion. In the intervening period, as the Chinese economy has surpassed the Indian economy, China’s ability to spend on its military has only grown.
Another notable difference between Indian and Chinese military expenditure is the pace of change. In India’s case, there were periods in the last two decades when military expenditure plateaued (from 2005 to 2007, and 2009 to 2013). By comparison, China’s military expenditure “rose for the 28th consecutive year” as per SIPRI.
India’s military expenditure in the global context:
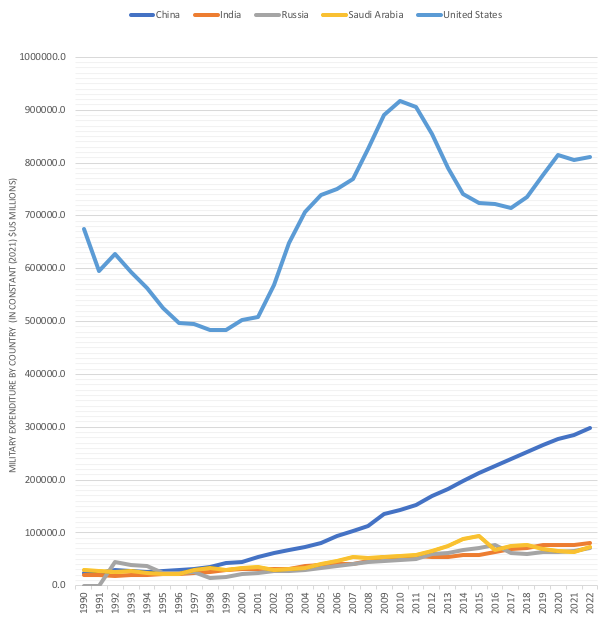
India, which has consistently ranked as one of the highest military spenders, had the fourth highest military expenditure in 2022 at $81.4 billion. The other top five spenders are the United States ($877 billion), China ($292 billion), Russia ($86.4 billion) and Saudi Arabia ($75 billion). These five nations together account for 63% of the global military expenditure.
As Fig. 4 shows, when it comes to military expenditures, the United States is in a different league. Reports often highlight the fact that the U.S. spends more than the next 10 countries combined. It is also imperative to note that of the 10 countries that the U.S. spends more than cumulatively, two states (China and Russia) are military adversaries - the rest are partners or allies.
Security in numbers?
India’s military expenditure has consistently risen over the past few decades, with a pronounced growth in the last ten years (see Fig. 2 & 5). As SIPRI notes, India’s spending grew by 47 percent from 2013 to 2022. A prominent driver of the increase in expenditure in the recent past is the prevailing tense environment along the India-China border following China’s actions in 2020.
When it comes to Indian military spending, it is important to note that a bulk of this budget is earmarked for personnel expenditure, including salaries, allowances, and pensions. As Ajai Shukla notes, during the financial year 2021-22, 55% of India’s military budget, an “alarming” figure, was earmarked for personnel expenditure.
The government has been aware of this issue. As Sushant Singh highlights, the Fifteenth Finance Commission categorically stated that the prevailing model of “pensions and salaries for defense personnel was unsustainable and needed a specific plan to reduce outlays”.
The ‘Agnipath’ scheme, which was the subject of substantial debate, is one step that the Indian government has taken to alleviate personnel costs. Shukla explains the scheme noting that it is “based on the truism that soldiers who enlist for shorter durations cost the government less each year than those who make a career of the military.”
While the merits of the scheme ought to be debated in the broader context of India’s national security, any potential gains that might be accrued through this scheme will take time to reflect in India’s overall military expenditure. Furthermore, a nation’s military budget reflects its security environment. A change (reduction) in India’s military expenditure will in all likelihood occur only after there is a substantive change in its security threat assessment. Till then, India’s military expenditure will only rise.
Note on data:
All the figures used here (unless stated otherwise) are in $US million (constant 2021). There are a number of limitations around military expenditure data. Part of this issue stems from the fact that there is no common definition for what constitutes military expenditure. SIPRI notes that military expenditure “should include” expenditure on a range of issues including personnel, operations and maintenance, procurement, research and development, military infrastructure spending, and military aid.
Furthermore, while SIPRI uses primary data for a country’s military expenditure where possible, there is opacity around these figures for certain countries like China and Russia. To mitigate this, SIPRI takes a number of measures, accounting for sources outside of primary documents as well. These limitations notwithstanding, SIPRI is generally seen as one of the most reliable sources of military expenditure data worldwide and is regularly cited in the media.
Links:
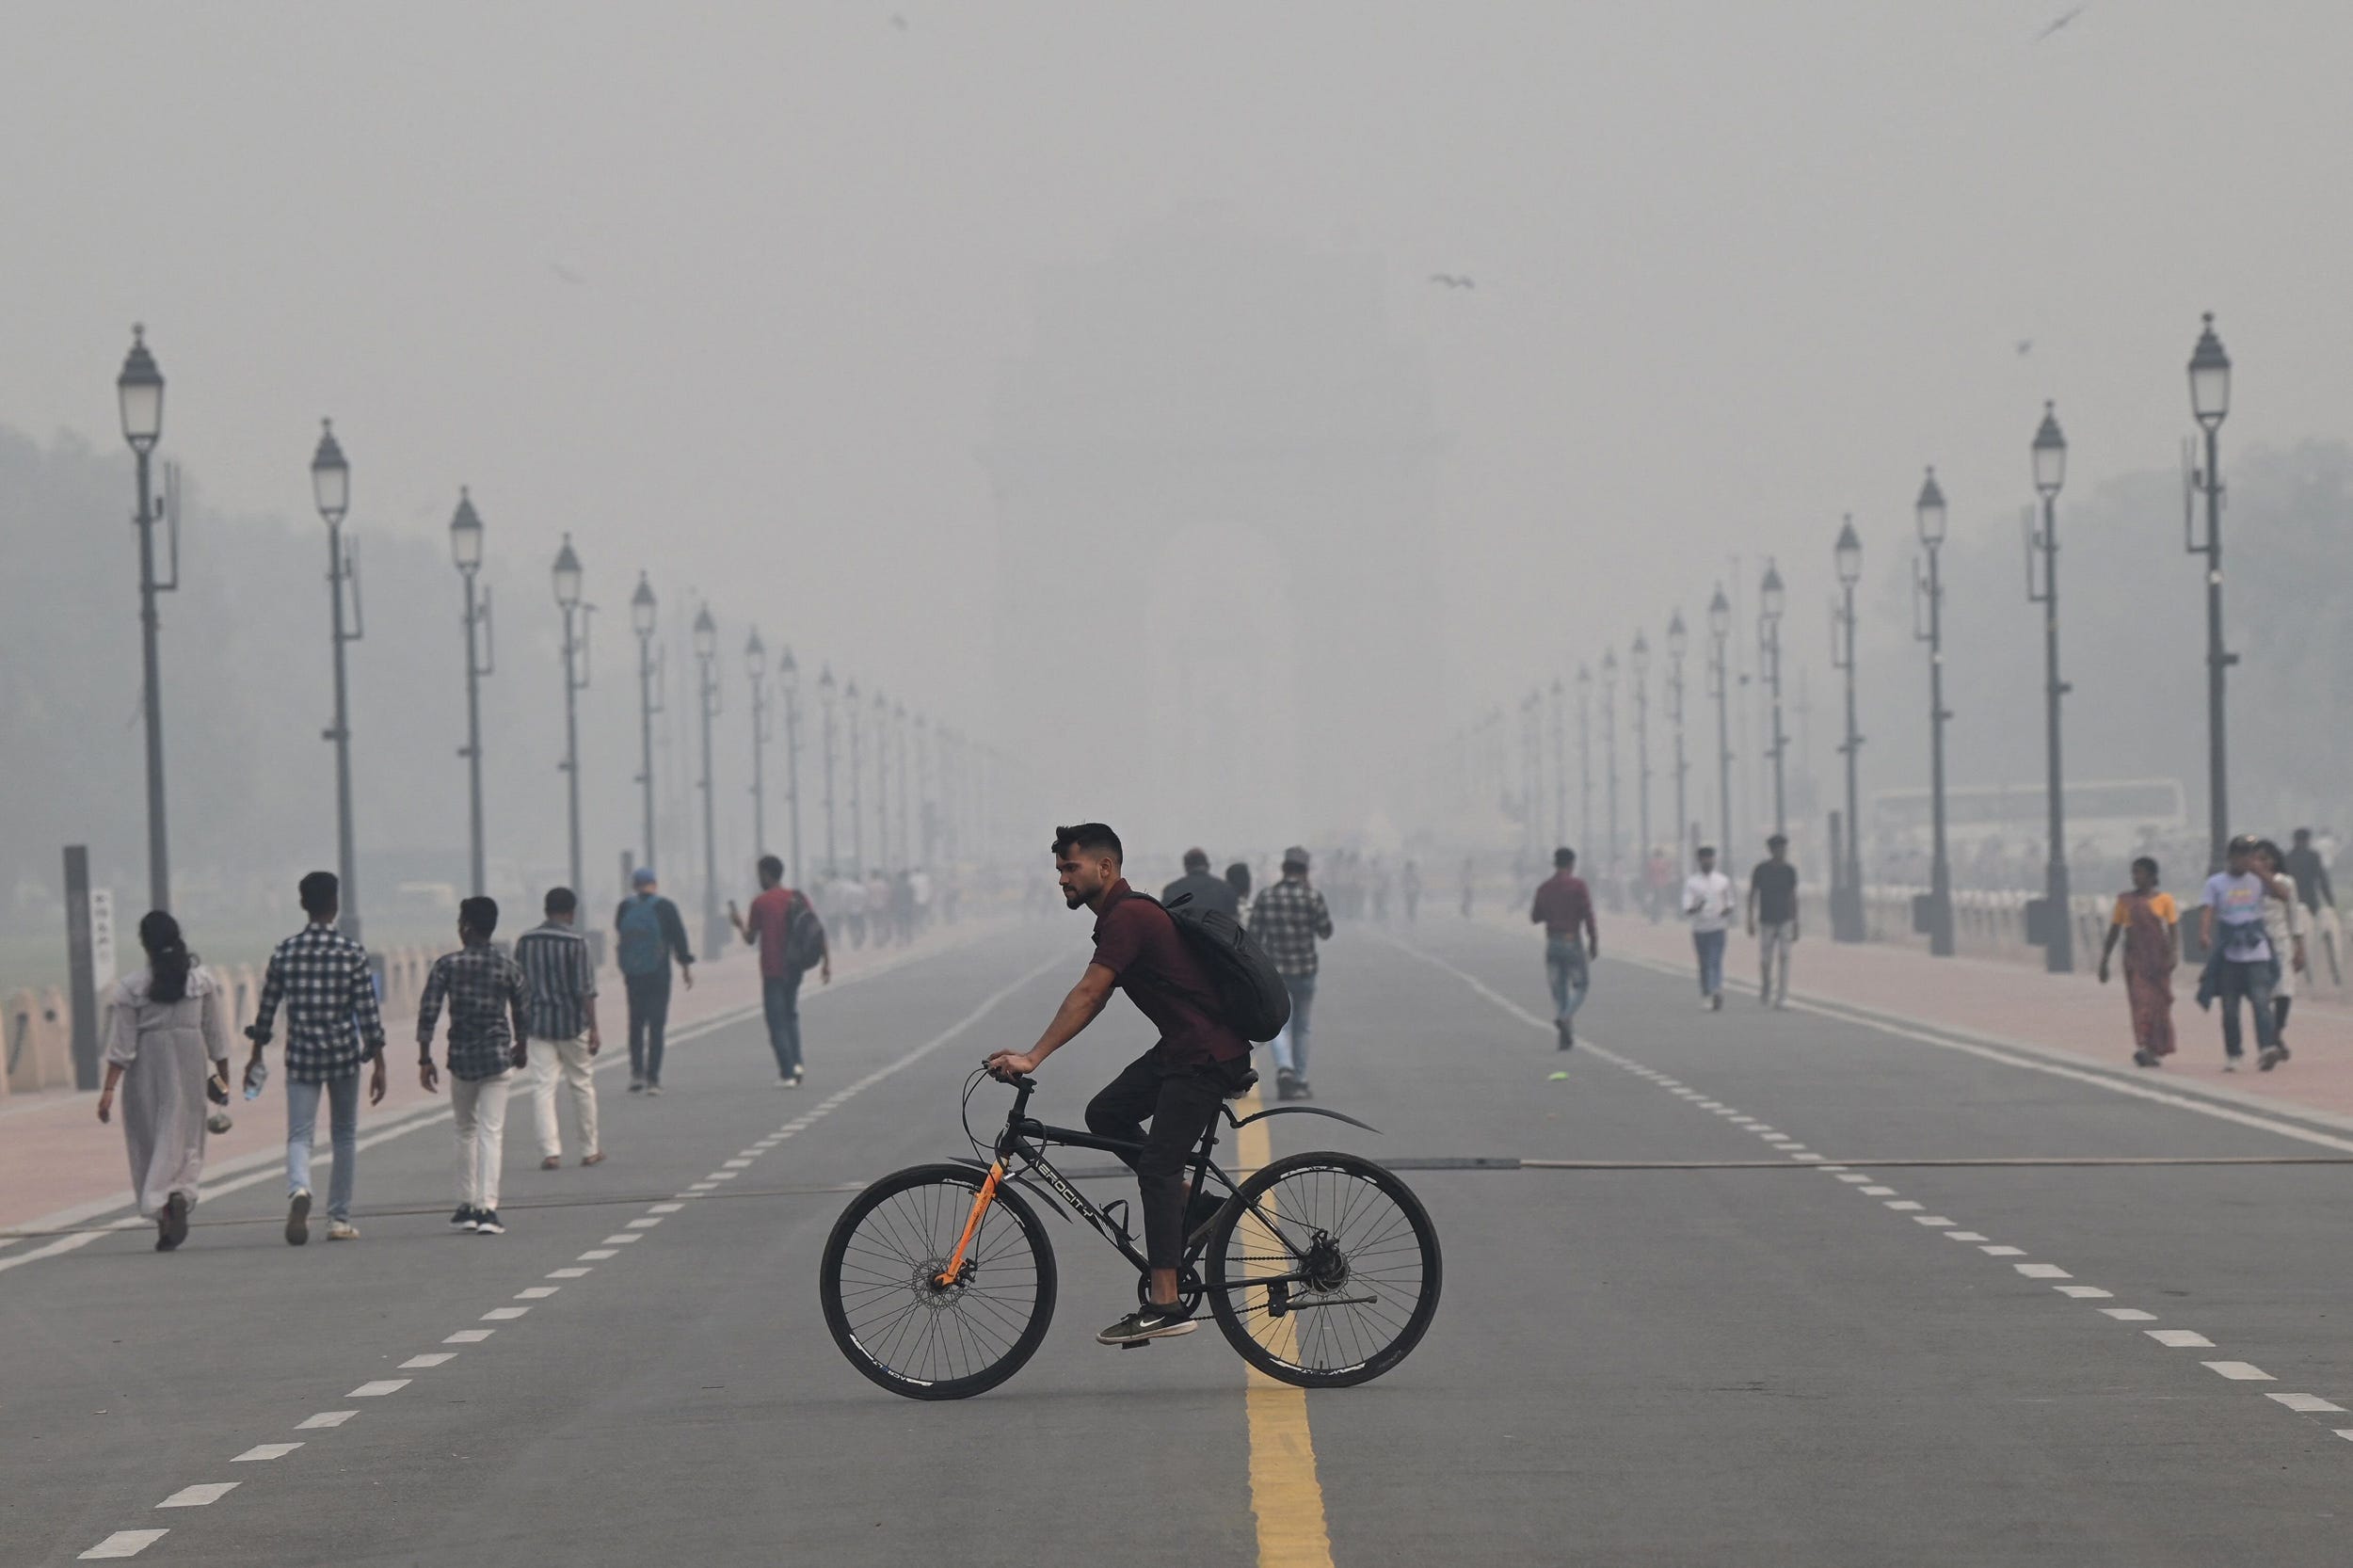
On pollution & policy: Of the 10 cities with the world’s worst air pollution levels, nine are in South Asia. As the World Bank notes, “Ambient air pollution is a public health crisis” in the region causing an estimated 2 million premature deaths annually.
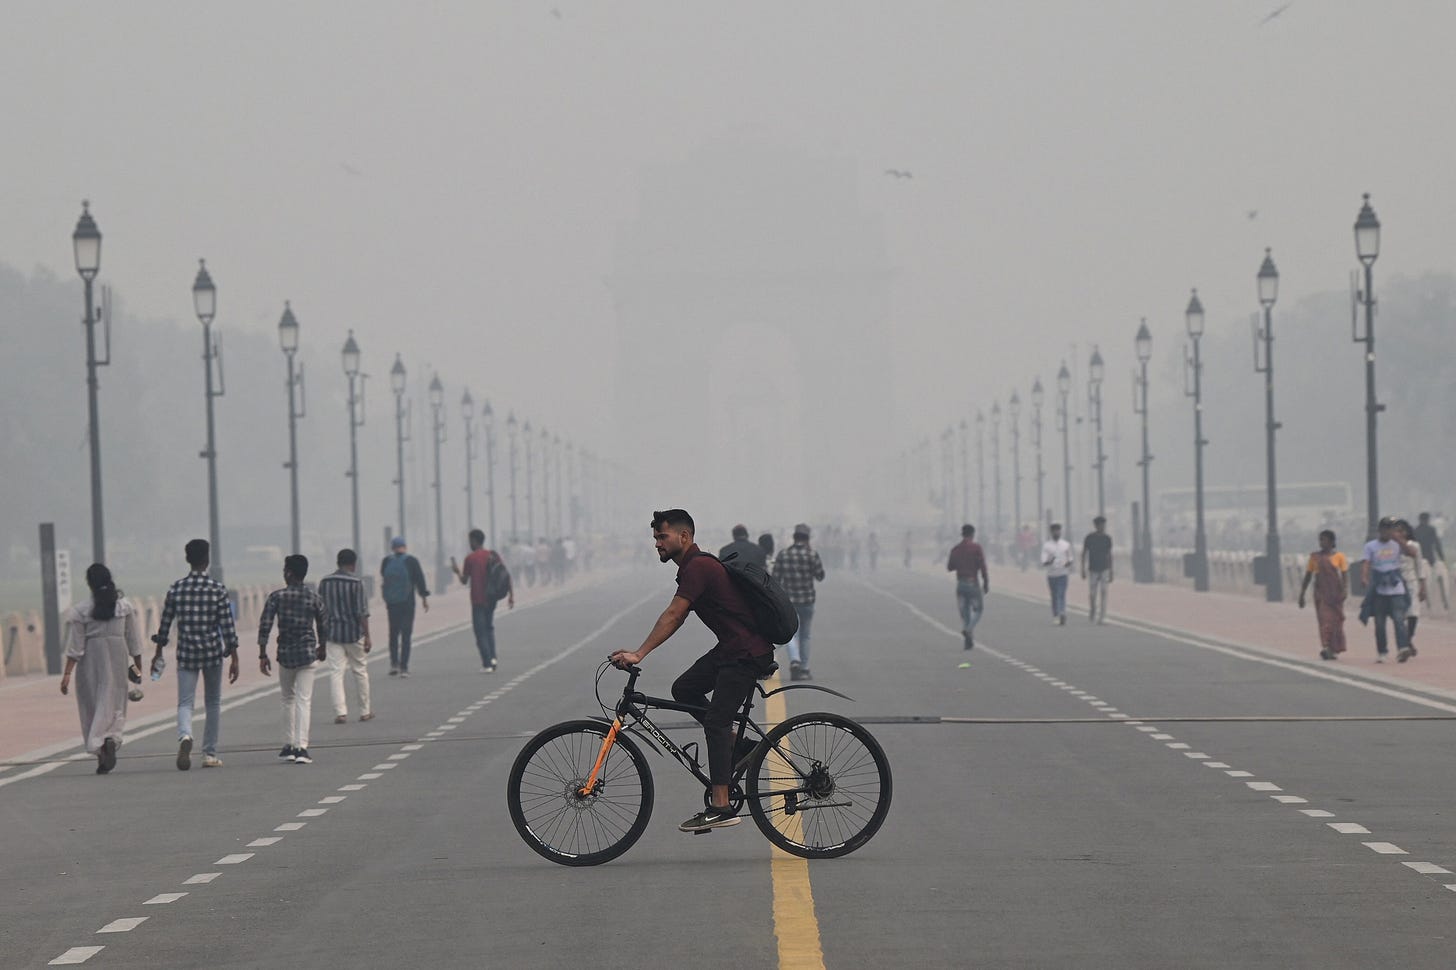
Credit: Arun Thakur, AFP - Getty Images Two recent studies shed light on different facets of air pollution. Shikhar Singh and Tariq Thachil field a large citizen survey in Delhi to better understand accountability failure. Their survey experiment reveals that partisanship blunts “accountability pressure” i.e. the citizens surveyed in Delhi selectively blame political parties for air pollution.
Gemma Dipoppa and Saad Gulzar study “if and when bureaucrats control air pollution from crop burning in India and Pakistan.”
Both studies use interesting research methods to tackle important issues that have significant public health ramifications. Crucially, both studies also outline policy interventions that might lead to positive outcomes.
World Bank’s report ‘Striving for Clear Air: Air Pollution and Public Health in South Asia’ highlights the regional sources of pollution, cost-effective ways to mitigate it, and the benefits of reduced pollution.
On Afghanistan: The Afghan economy, which contracted by a whopping 20.7% in 2021, followed by a contraction of 6.2% in 2022, has now “stabilized” as Kate Clark of the Afghanistan Analysts Network notes. However, as she argues this “apparent stability” is very fragile. This AAN report uses World Bank data and presentations made by Taliban ministers and representatives to paint an economic picture of a nation that has most recently suffered devastating earthquakes.
On global value chains: A report by the Bank of International Settlements (BIS) uses firm-level network data to show that “global value chains have lengthened although without the accompanying network densification that might indicate that supplier relationships are diversifying.” Despite these results, the authors caution that these recent developments haven’t reversed the broader trend of “greater regional integration of trade” (especially in Asia). Even so, the (re)alignment of global value chains deserves close scrutiny “given the profound implications for the future direction of globalization.”